

Flowcharts are one of the basic building blocks of system design. They depict complex details of a proposed system through simple rectangular, diamond-like and circular shapes. They’re a picture that can explain a layman what a technically advanced, IC powered system would behave like when fully functional. So it is extremely important that designers who make flowcharts make them right. And that’s because when a business approver views a flowchart, that image is how he perceives the system to be. Thus, to avoid later confusions a flowchart needs to be bang-on.
If you’re sure your flowcharts are absolutely correct, good for you. If you think otherwise or would like some reassurance, trust Lucidchart to help you out. This online flowchart maker will make sure you don’t mess up the very first step of system development.
Lucidchart – draw better, depict more!
The online diagram application from Lucidchart makes it extremely easy to sketch as well as share professional flowcharts. It is compatible with a host of other programs including Google Apps and Microsoft Visio and allows users to export their diagrams to standard file formats or publish them through a convenient online viewer. The best part about Lucidchart is its ease-of-use; from a beginner to a pro, anyone can create great flowcharts through it. The tool is very intuitive; the shapes just snap together and glue a designer through the process of setting up a diagram.
There are three different types of flowcharts that can be created through Lucidchart depending upon what end-use you’re going to put them to. Here they are at a glance:
IT / Engineering
For engineering or IT systems, Lucidchart offers competent Network Diagram designing tools. The ERD (Entity-Relationship Diagram) tool of the platform helps you instantly generate database tables and schemas with GraphViz import, smart shape prompts and a multi-featured API. Lucidchart is tailor-made for technical diagrams and this focus is evident from their feature set.
Business Diagrams
With thousands of shapes and icons, instant organization charts, and bulk Visio imports and exports for business use, Lucidchart helps build business diagrams and improve productivity, build project maps, improve sales processes and customer service flows. Plus, its drag-and-drop editor gets the work done in almost half the time. Compatible with different operating systems (Mac, Windows and Linux), all you need to start using Lucidchart is a web browser.
Product Management & Design
A sophisticated graphics palette, fully customizable editor, keyboard shortcuts and master pages helps put neat product management diagrams in place. With the ability to modify grid settings, hex codes, page layout/size, fonts and even the angles of lines, Lucidchart is probably the most flexible online flowchart maker.
This is how it rolls
To experience Lucidchart, try the demos available on the portal. You can try out engineering, business or product management flowcharts through their dedicated demos. Navigate to any of these pages by clicking on the direct links to them on the homepage. Thereafter, scroll down and click on “Try the demo” button.
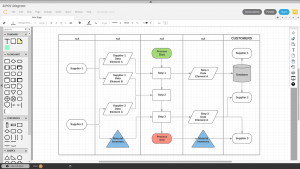
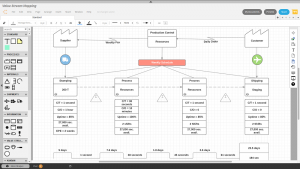
In the Engineering & Business demos, at first you’ll see a sample ERD on the canvas with a single entity (user_account) and various attributes. You can play around with attributes adding more or removing some by single-clicking the anywhere on the diagram to open a ‘Settings’ box. This box can also be opened through a ‘Settings’ icon on the upper-right corner of the entity box. On clicking on ‘Manage Fields’ within this box you’ll see a pop-up displaying all field names, their data-types and their Primary Key – Foreign Key status. Add or remove fields as per requirement and click ‘OK’. The attributes can also be modified by double-clicking on them directly and typing, but we suggest the pop-up method to avoid typos.
To add more entities to the diagram, click on any of the connecting points on the edge of one entity and drag it away. Release the mouse pointer at a random point on the canvas; you’ll see a prompt asking which shape you wish to add. Select the desired shape and it will appear there. At any point, you can visit customization options and tutorials from a panel on the right corner of the canvas.
You can change the diagram from an ERD to UML or Org chart or more by clicking on a ‘More Shapes’ button on the bottom-left corner of the screen. The pop-up window that opens on clicking this button also provides you the option to import Visio Stencil or Custom Shapes into the diagram. To collaborate directly through Hangouts, a convenient chat window is provided next to the ‘More Shapes’ button at the bottom and a Comment box on the upper-right corner.
In the product management demo, your drawing canvas will have a Smartphone template drawn over it with several customizable fields. Editing options, chat window and comments section are placed at the same spots with options differing for each type of diagram.
If you wish to save your diagram, you’ll need to create an account with Lucidchart first. The signup is free and quick and the tool automatically shows a reminder to do so when you haven’t saved your work after every couple of seconds.
No Comments